
Algorithmic or algorithm art includes designs generated by an algorithm. Algorithmic artists are sometimes called algorists.
I wrote the R script to generate the featured data art all by myself using the concepts of Rose Curves and in the process was able to have an in-depth look into what really happens during the construction of code-generated flowers.
You can read my introductory post on Math Art with Phyllotaxis, followed by Asteroid Impact, Mandala Dragonflies and Data Dreamcatchers!
Rose Curves
In mathematics, a rose or rhodonea curve is a sinusoid plotted in polar coordinates.
These curves can all be expressed by a polar equation of the form,
r = cos(kΘ)
Wikipedia
In short, rose curves are interlocking loops connected at a central point, much like one would draw a simple flower with the free hand.

They are created with two parameters when generated by computers:
- n = number of points
- d = number of loops
During construction, the n and d parameter works together to generate the number of petals (as a multiple of k):
- k = n/d
- when k is even then the number of petals equals k (or k*1)
- when k is odd then the number of petals equals k * 2
This makes more sense when you follow the graph below
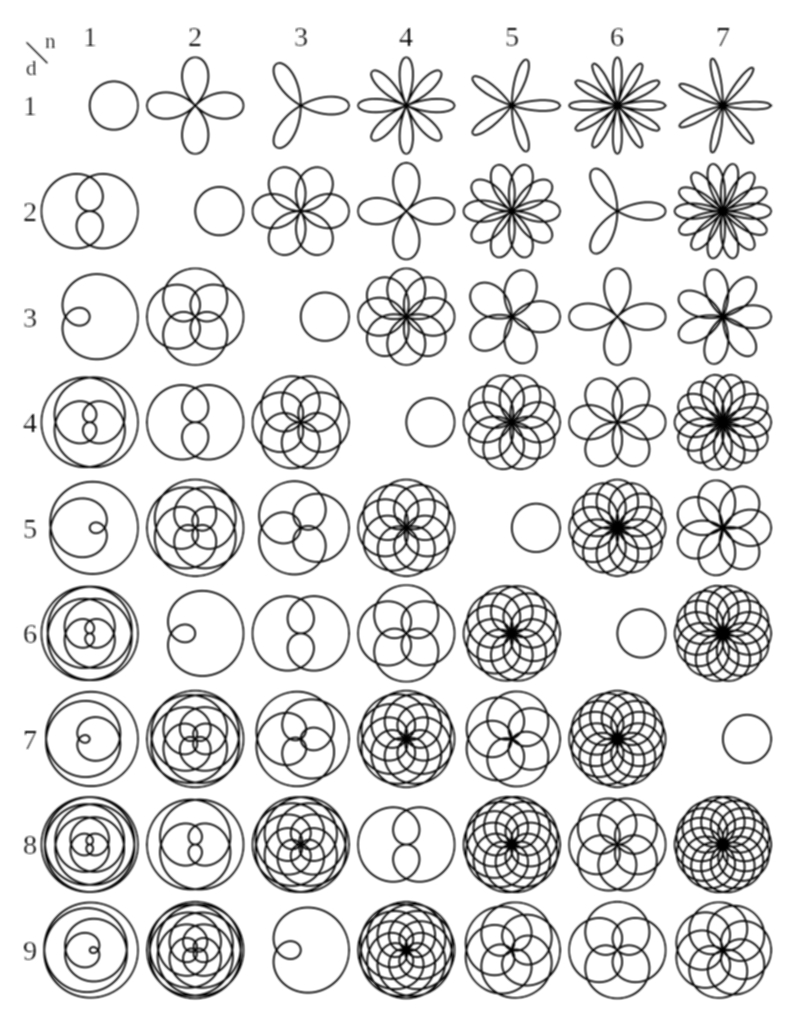
based on the polar-coordinates equation r=cos(θ*n/d).
In this chart, the values of parameter n varies from 1 to 7,
while d varies from 1 to 9.
Wikipedia
- n = 1 and d = 1 then k =1 and you get a circle
- n = 2 and d = 1 then k = 2 and you get a four leaf clover (2*2 = 4 petals)
- n = 1 and d = 2 then k = 0.5 and you get half a petal, connected by interlocking loops … you can read more about the exact mathematics on Wikipedia.
The top graph is generated with lines, I generated similar plots using points and polygons.
Point Plots
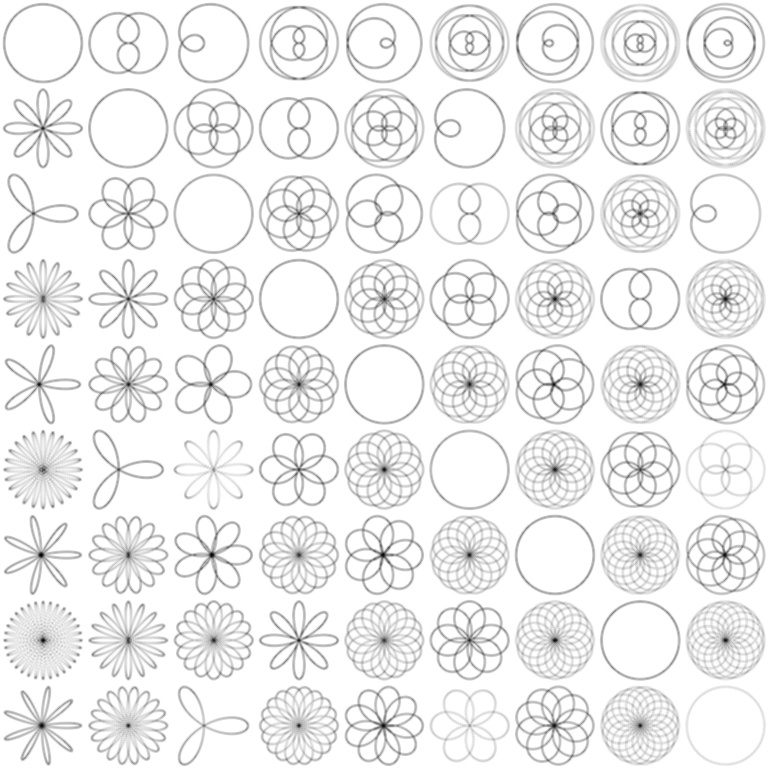
It seems that the algorithm merely repeats itself at various places, especially when the ratio between n and d is 1:1 such as along the diagonal line from the top left to right of the image.
However, the polygon plots reveal that this is not the case!
Polygon Plots
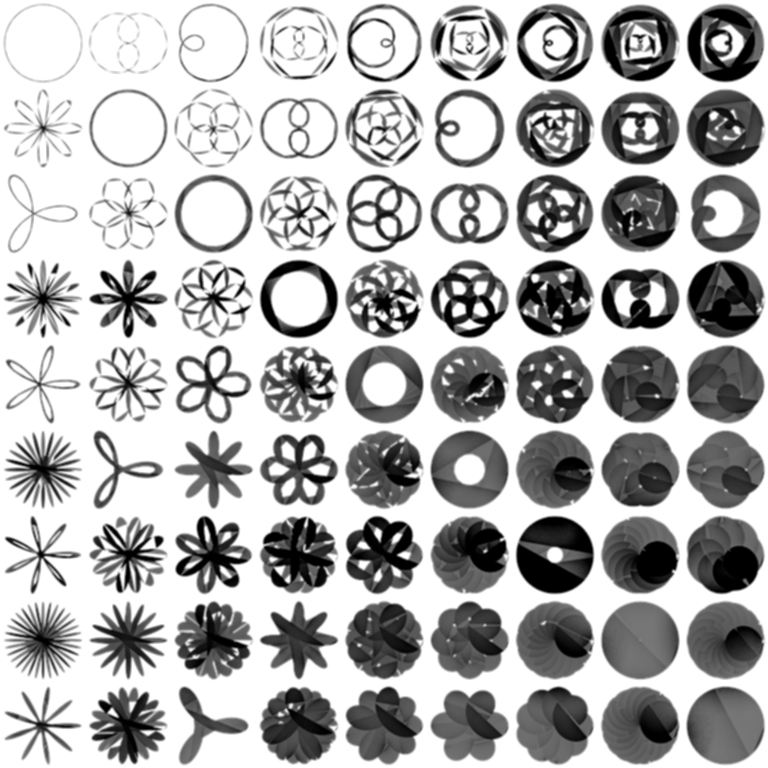
Here you would notice that the plots are generated in repeating loops and that the width/thickness of these loops increases as we move diagonally down the graph.
This makes for far more interesting shapes, especially with the custom colouring that I coded into the loops!
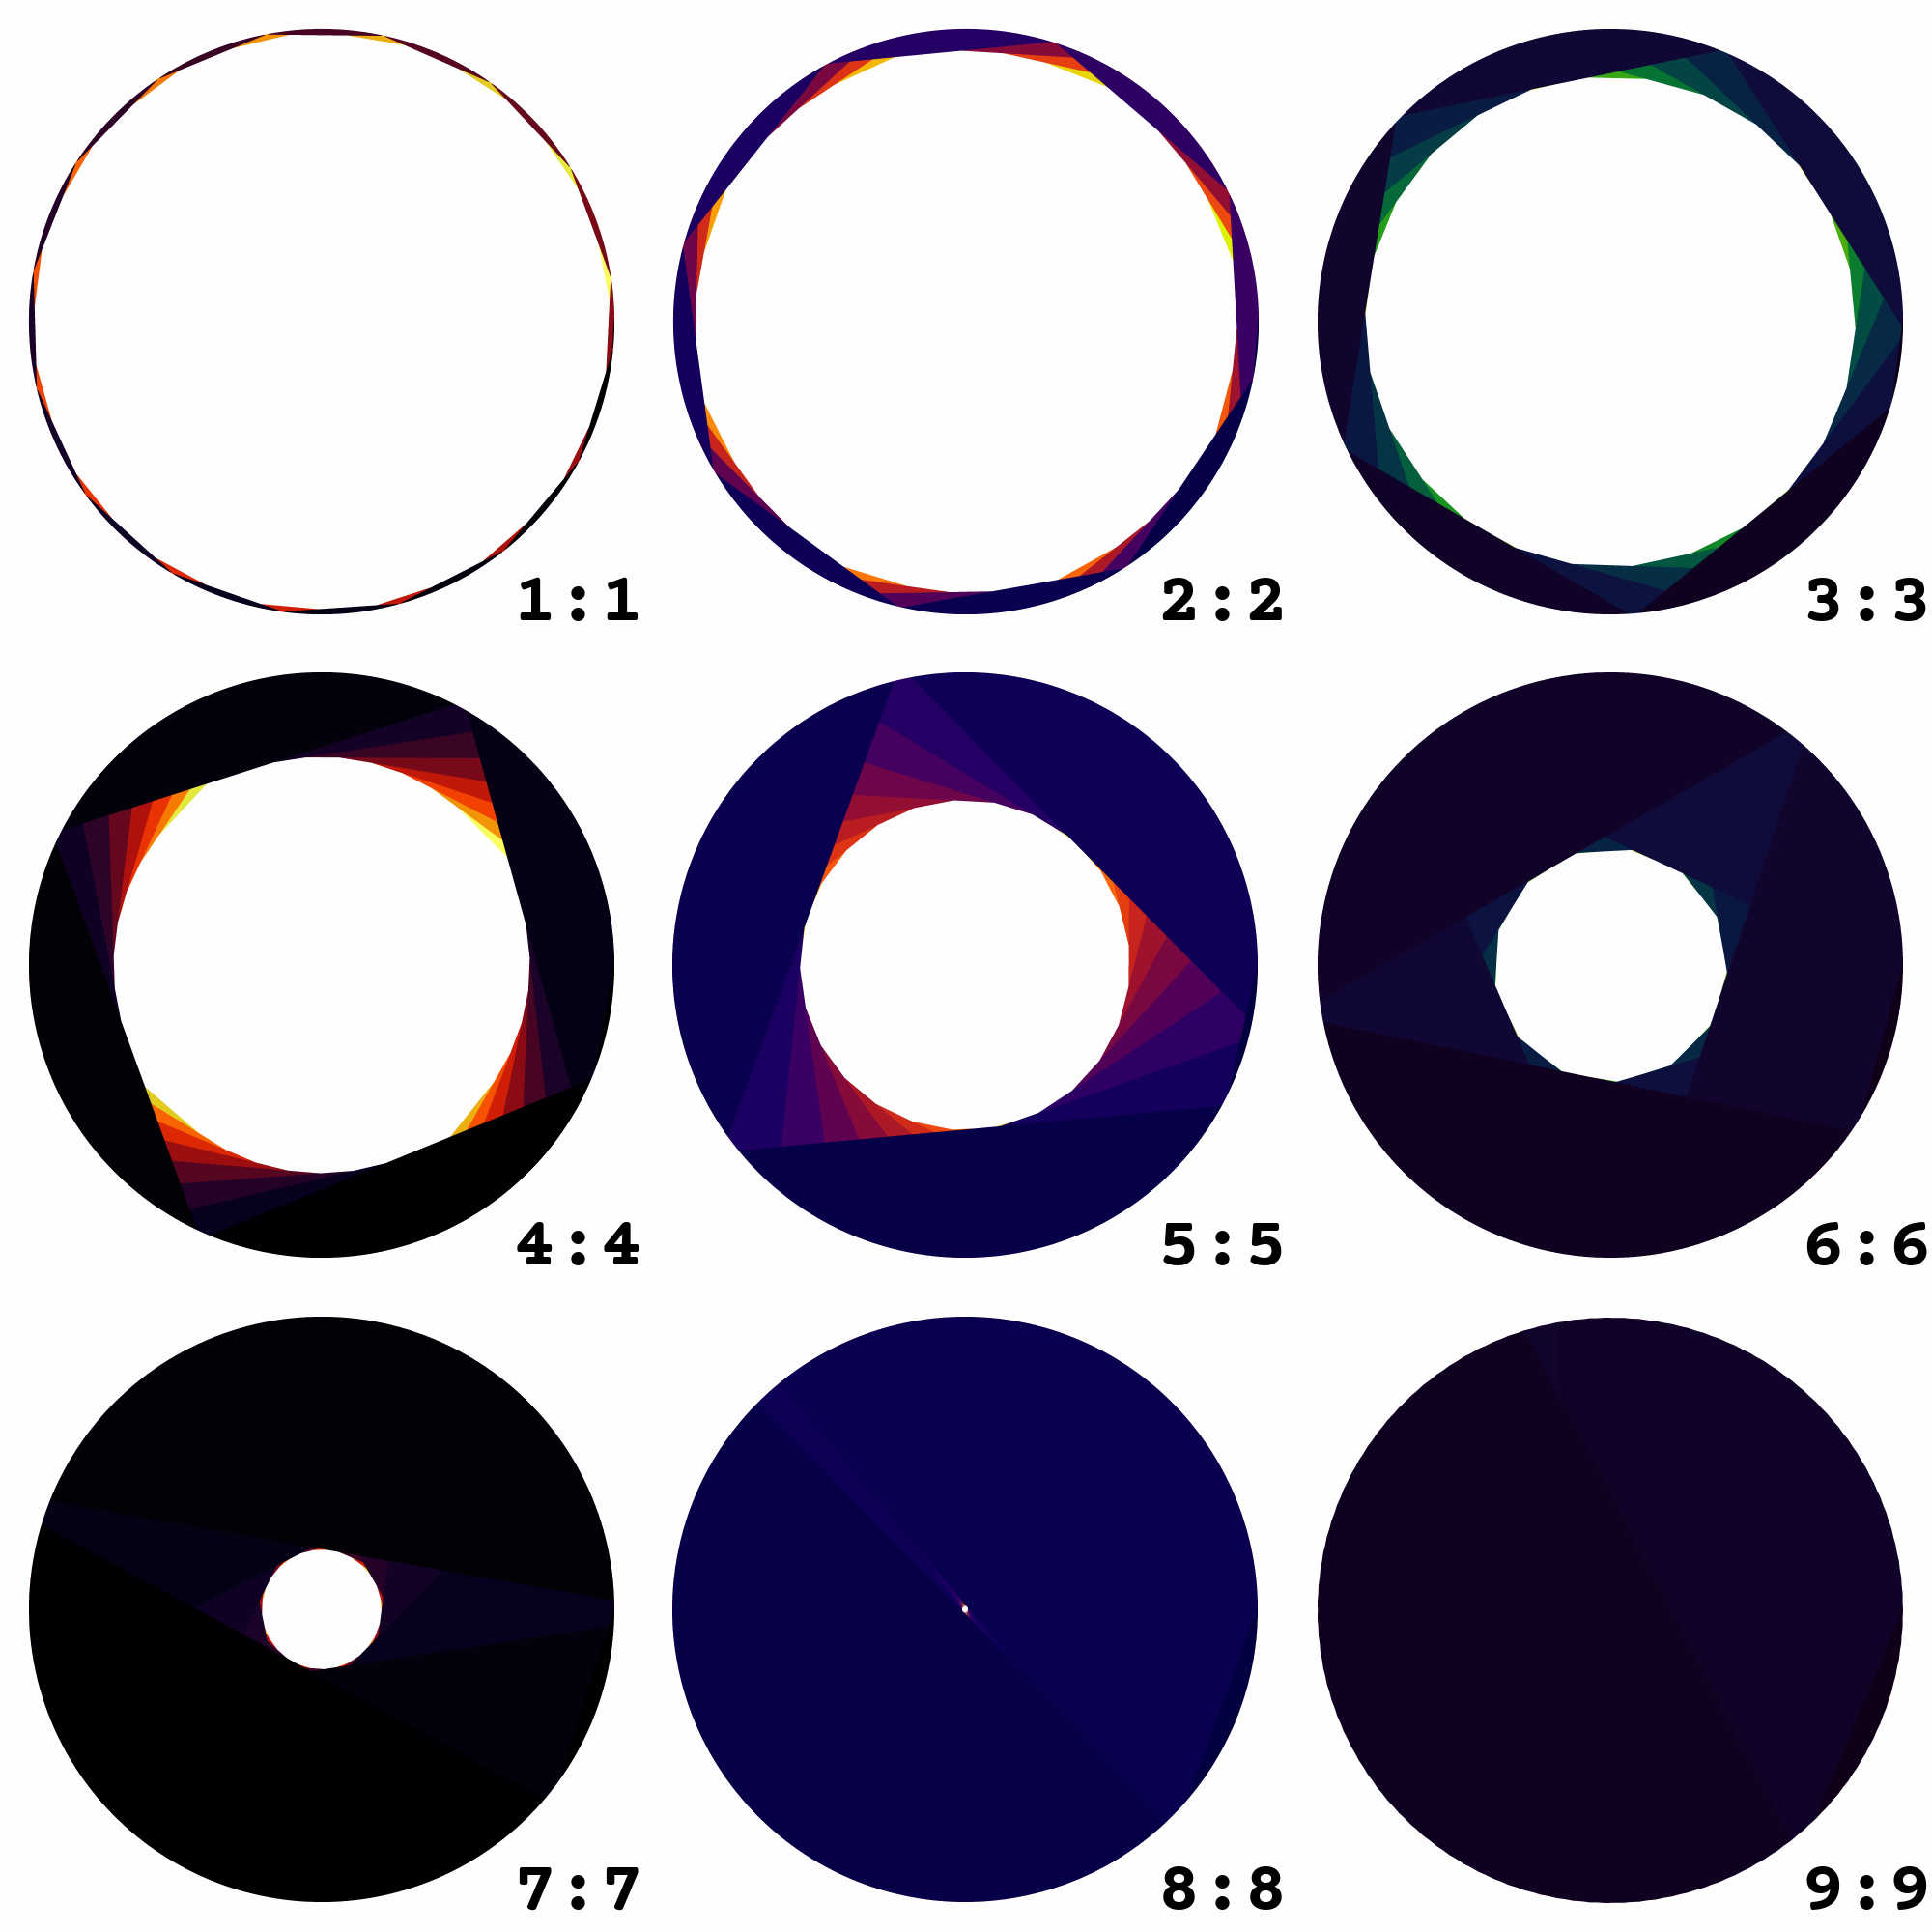
Add Some Colour
Finally we end up with coloured polygon rose curves as well as some striking product designs!

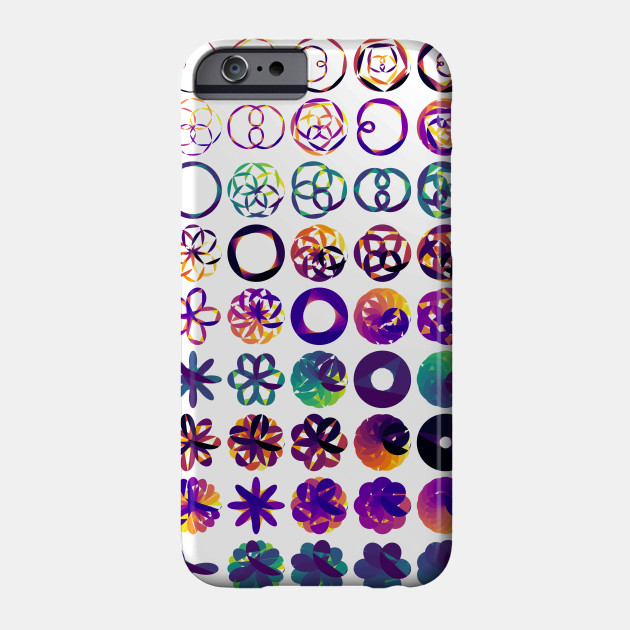
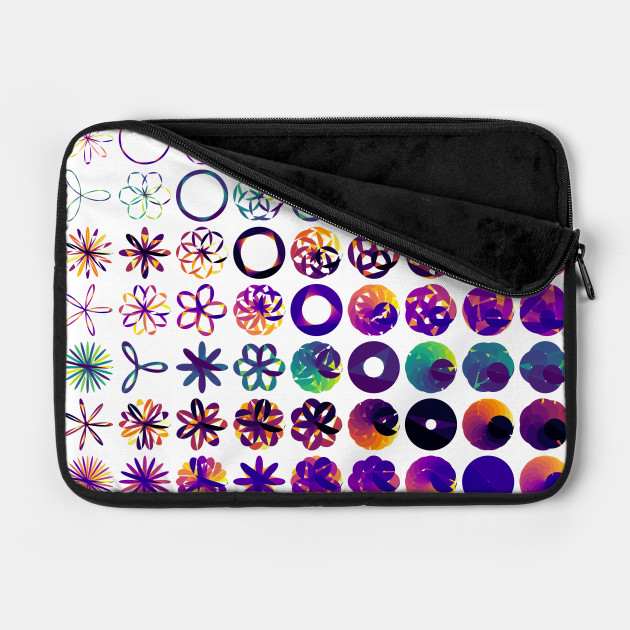
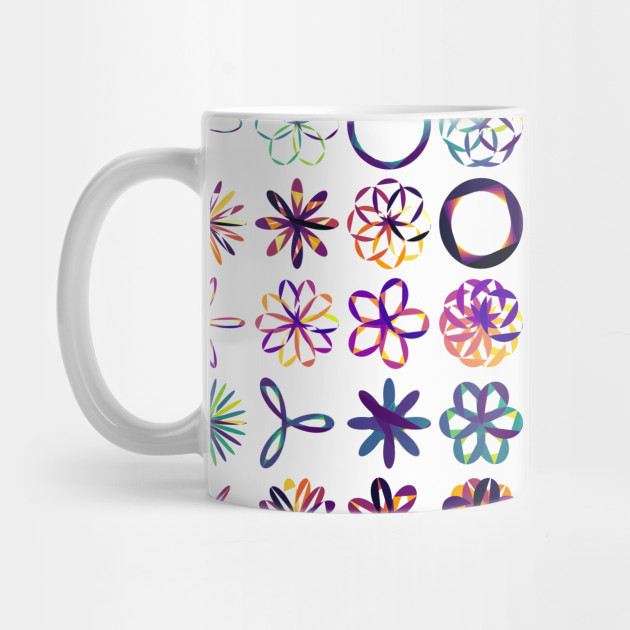
Featured Products
Below is an example of combining the Rose Curve plots with bar chart butterflies and leaves!
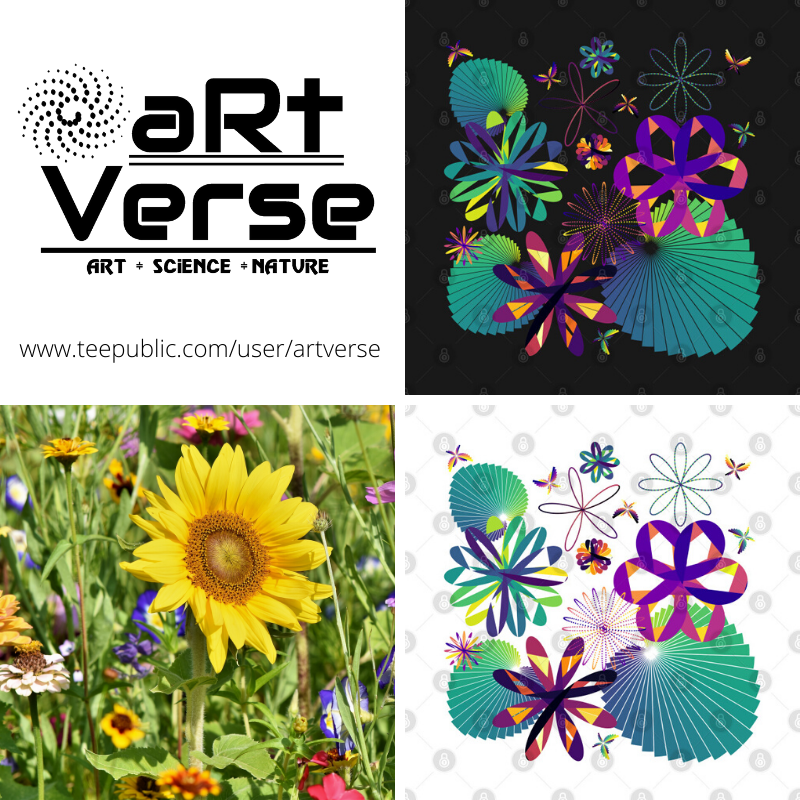
Black Version
White Version
CC-BY-NC 3.0 – Images are free to use for personal and non-commercial projects given attribution to Dr Tanzelle Oberholster
See More At My aRtVerse Store!
aRtVerse @ Teepublic
ART SCIENCE NATURE
Want to start up your own store? Sign up here as a Teepublic Designer!

12 thoughts on “Algorithmic Art: Flowers, Roses and Rhodonea Curves”